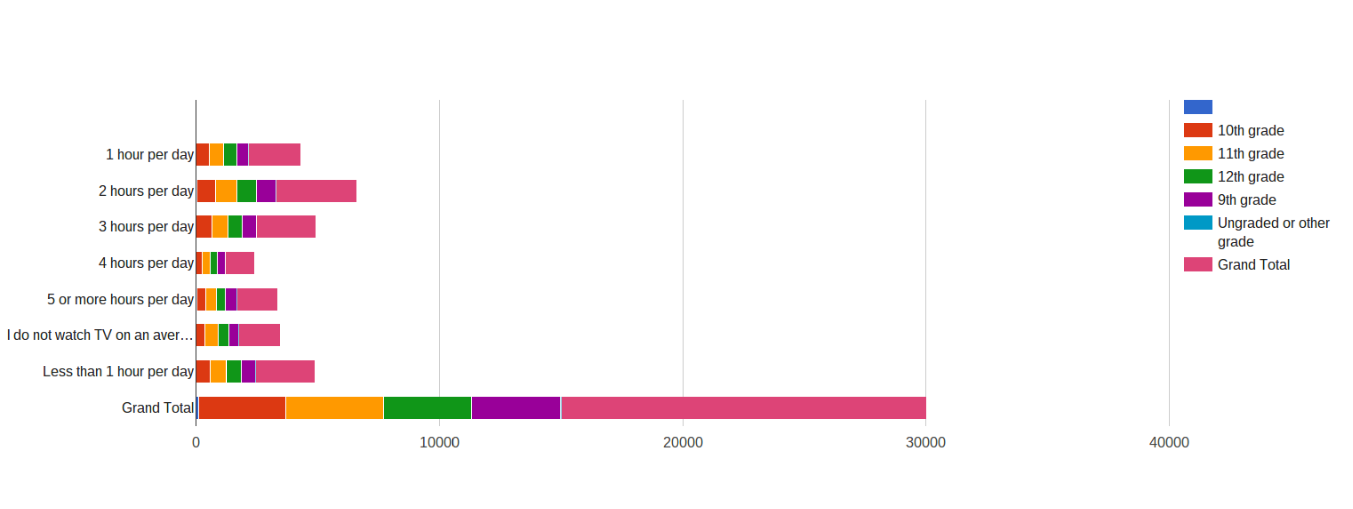
Graph 1: This graph shows us how much each class of students watch T.V. over a week. The information shows that juniors watch the most T.V. out of all the grades.
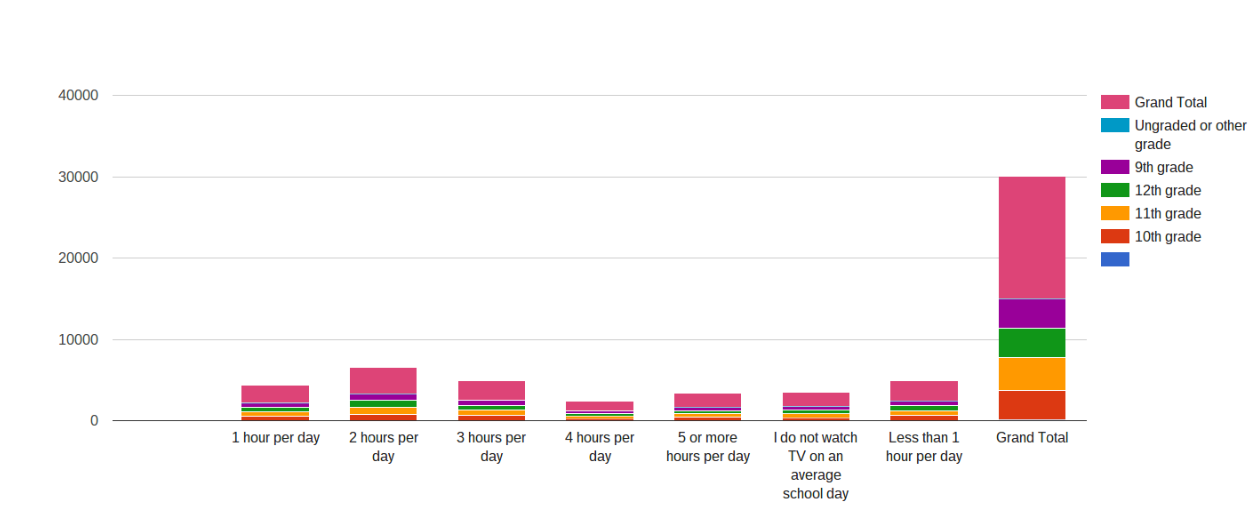
Graph 2: Graph 2 also shows what Graph 1 shows, but in a different format. Graph 2 still gives the information that Juniors watch the mist T.V. over the span of a week versus the other grades.
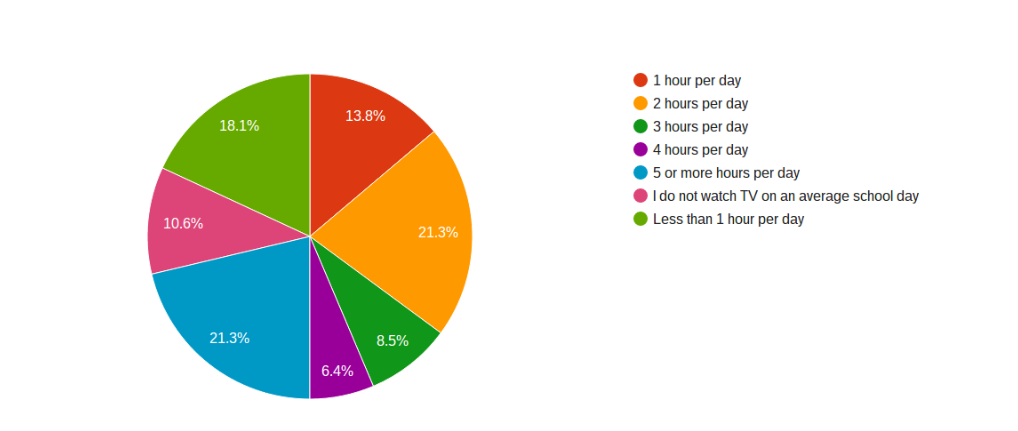
Graph 3: Graph 3 gives the information that Seniors watch the most T.V. over a span of a week, but the 2 other charts give the data that Juniors watch the most T.V. over a week.
Question: Is there a correlation between a students GPA and the time they spend watching T.V.?
In these charts you can see the GPA each class student gets, and how much T.V. they watch.
These charts give us data that Senior watch the most T.V. out of all of the classes. This can be seen that of the 100% of people who had ansewed the 20% of Seniors who had answered the survey, 18.1% of them spend less then 1 hour of T.V. a day, but have the highest and most efficient grades out of all of the classes. The people who had answered had given the input that the time spent watching T.V. may effect a students GPA. This leads us to the conclusion that of the people who have a higher GPA they are also the ones who watch less T.V.
| Home |
| Sleep vs. Videogames |
| GPA vs. Time Watching TV |
| Grade vs. Sleep |